
Ecosoft Cloud Manual EN v3.5
Remote access to Ecosoft devices
Contents
1 Connection to the Ecosoft server
1.5.1 Device Management Page for EcoSwitch
1.5.2 Device Management Page for SGC
Connection to the Ecosoft server
Introduction
The Ecosoft cloud server is available for Ecosoft devices: Ecoswitch Basis, EcoSwitch Plus, EcoSwitch Pi, Smart Grid Controller 1, Smart Grid Controller 2, AircoSwitch and Ecosoft P1-meter.
Log in or register via https://cloud.ecosoftenergie.nl
Connecting a Device
Optionally, data collected by the an Ecosoft device (EcoSwitch, SGC or another Ecosoft product) can be stored on the Ecosoft server in the cloud. The server stores data for a long period of time, and will be accessible by you from outside your own network. Additionally, you can perform remote actions.
Connecting to the Ecosoft server is optional and not necessary for your device to work properly.
The Ecosoft server has the following web address:
https://cloud.ecosoftenergie.nl
You’ll need an account at the server to start using it. Then you can connect one or more devices to your account.
To connect a device to your account:
• Open the web interface of the device itself (EcoSwitch, SGC, etc.)
• Click on Configuration
• Click on Configure Cloud
• Click on the button “Pair device”
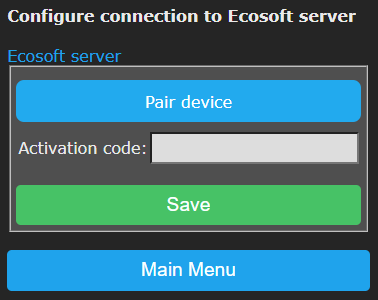
The browser will open a new window or tab, and will direct you to the server at cloud.ecosoftenergie.nl. This link to the server includes the ID of the device to connect it more easily.
• Create an account or sign in to the server. When necessary, change the language at the server by clicking on the globe.

• Click on the Confirm button for confirmation
• Click on Register to add the device to your account
• Copy the activation code
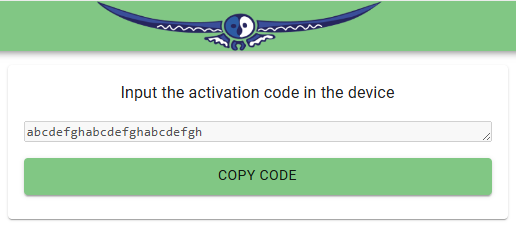
• Return to the window or tab of the device, paste the activation code in the edit box, and click on Save.
When the connection is made, you can choose which data should be sent to the server:
• Power consumption: Amount of electrical power (in Watts) consumed with time stamps. This is available for all devices measuring power consumption: o.a. EcoSwitch Plus, EcoSwitch Pi, Ecosoft P1-meter.
• Events: For example, switch on and switch off events.
• Perform actions: Enable this option to allow remote control of the EcoSwitch via the server. Available actions are e.g. remotely switch the EcoSwitch on and off, and remotely make adjustments to the Energy Plan.
The data is sent periodically (not real-time). Especially when the connection has just been initiated, it may take a while before all data has been sent. Expect actions will be performed with a delay, after 5 minutes at most.
Stop sending data
You can stop sending data at any time via the web interface of the EcoSwitch. You can do this by disabling the options (untick the boxes) or by disconnecting the device from the Ecosoft server. Sending data will then be stopped. Disconnecting does not remove data from the server, but will stop sending data.
Remove data from server
Note: Removal of data from the server is possible at the server itself, via the “Delete Device” button on the Device Management page of this particular device at the server.
Accessing data and graphs
The data is presented in graphs. Open https://cloud.ecosoftenergie.nl in your browser and sign on, or access the server via the web interface of the device: click on Cloud Connections and click on the link “Device at Ecosoft server”.
In the Ecosoft Dashboard, click on the icon of the device. For the EcoSwitch, graphs are shown at the Power Consumption tab.
The graphs show energy price data as well.
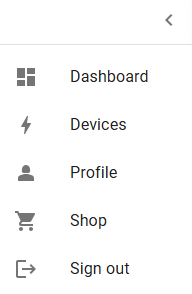
Ecosoft Server Menu
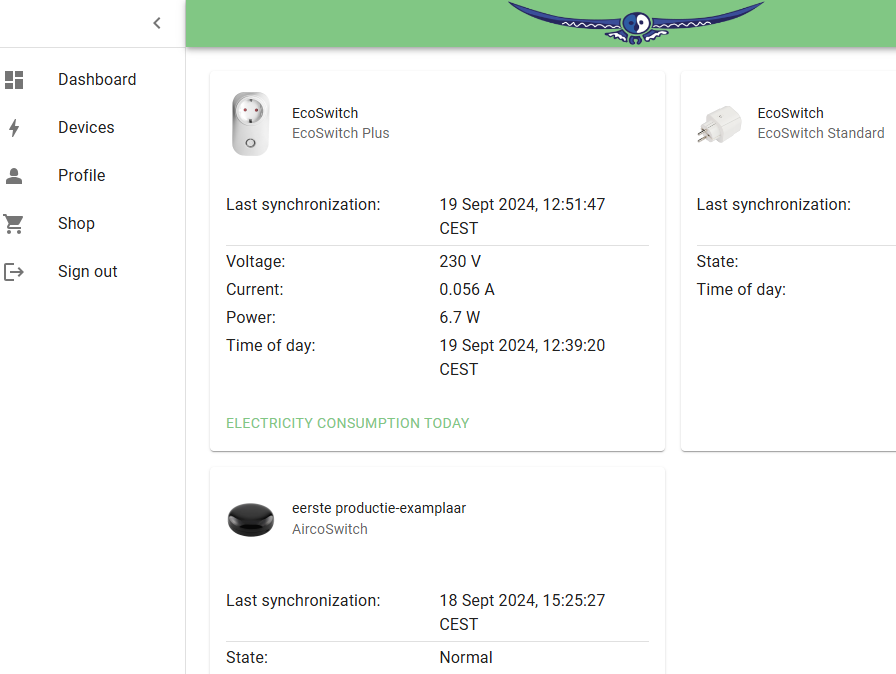
The Ecosoft cloud server has a number of menu items in the pane on the left: Dashboard, Devices, Profile, Shop, and Sign out.
Ecosoft Server Dashboard
 Reach the Dashboard from the left menu.
It has three parts:
- Devices overview
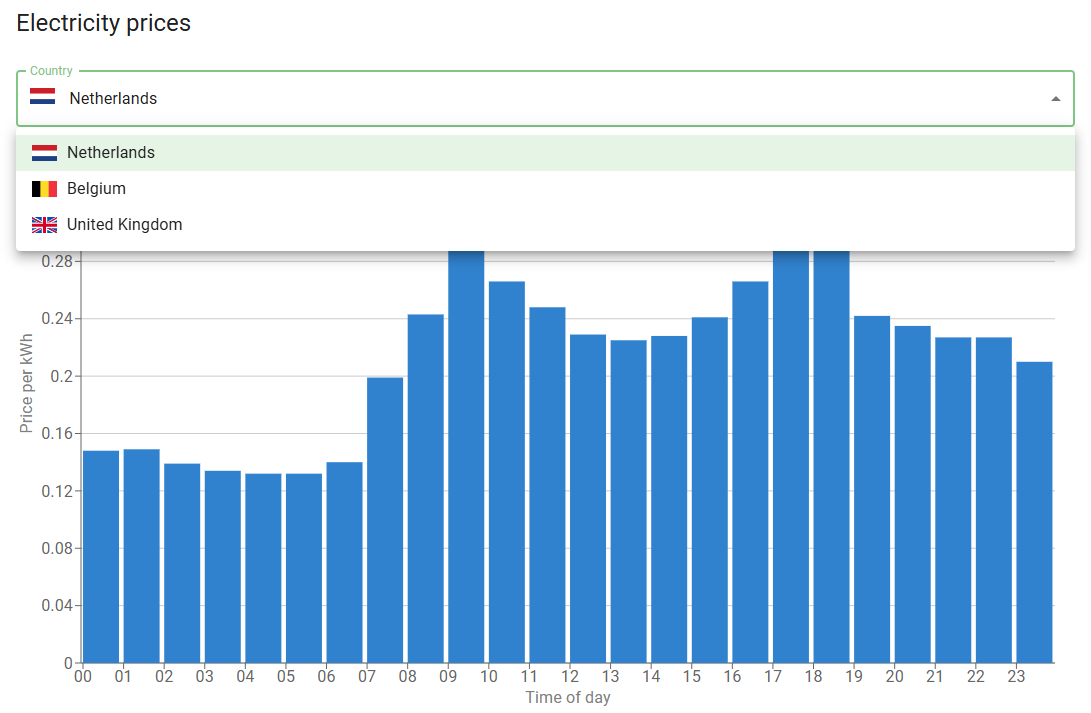
- Graph – Electricity prices
- Graph – Gas prices
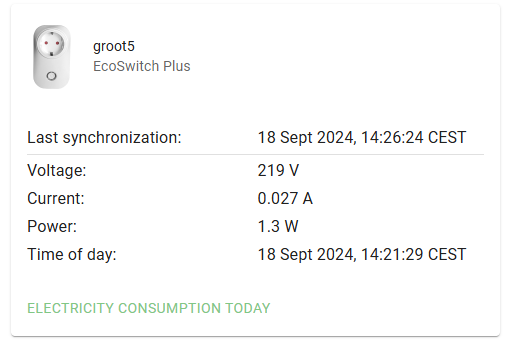 Every connected device has its own “card” or “Device Summary” on this page.
It shows the date and time of the last synchronization (between device and server)
If available it will show metering data 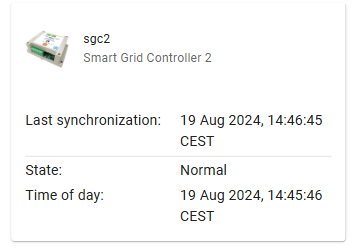 (voltage, current, power) and time of day (when the measurement actually took place).
Click on “Electricity Consumption today” to view today’s totals for electricity consumption, actual costs, costs with average price and achieved savings.
Graphs of electricity and gas prices are also shown on the Dashboard.
Device Management page
Every device that has been connected to the server has its own device management page. This page has a number of tabs, among others the Settings tab.
Note: If it is not possible to view or change specific things, then grant permission via the web interface of the device. See the first paragraph of this chapter.
Device Management Page for EcoSwitch
Click on Dashboard, find the EcoSwitch and click on it. You will reach the Device Management page of the EcoSwitch where you can adjust more settings and view details. This device page has a number tabs:
This device page has a number of tabs:
- Overview
- Power Consumption
- Events
- Settings
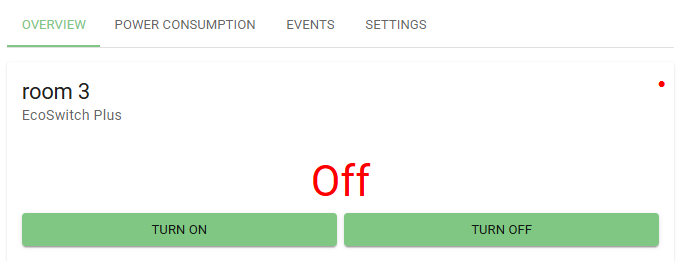
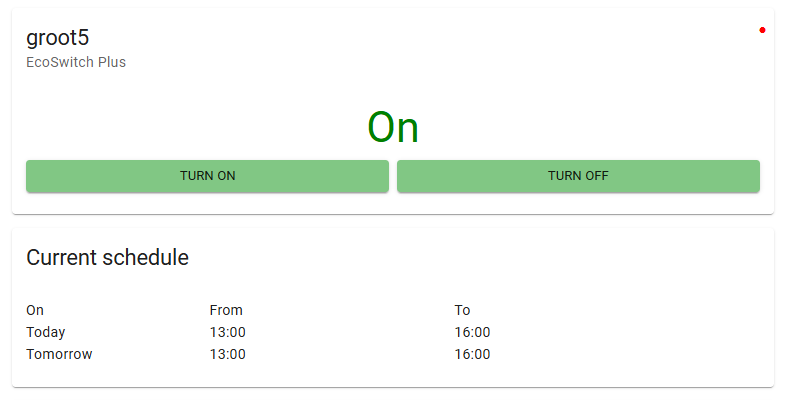
First TAB – EcoSwitch Overview
The “Overview” tab shows information on the Ecosoft device
- State of the device: on, off, etc.
- Buttons for remote switching of the device
- Current Schedule: Overview of performed and planned automated switch events.
- Settings: Change the device name here. This name will be shown in the Dashboard and Devices List.
- Service: Shows the number of days of service with the current license. License extensions are available on the website.
- Last synchronization: Timestamp of time and date of the most recent moment the device sent data to the server. The device only sends something when there is actually new data to send. Therefore this moment may be behind the current date and time.
- Voltage: measured power in Volts.
- Current: measured current in Amperes.
- Power: measured power in Watts.
- Time of day: Timestamp of the measurement. This is not the same as the timestamp of the sending of the data.
- Delete Device: Button to remove the device from the account completely. All data sent by the device will be deleted from the server. Synchronization will be stopped. When you wish, you can go to the web interface of the device and connect it to the server again, and send the available data from the device to the server again.
Second TAB – EcoSwitch Power Consumption
The tab “Power Consumption” shows a number of graphs.
For these graphs, you can check or uncheck the boxes “VAT” and “other taxes”. The “Today” button sends you to today’s graph. You can choose another date as well.
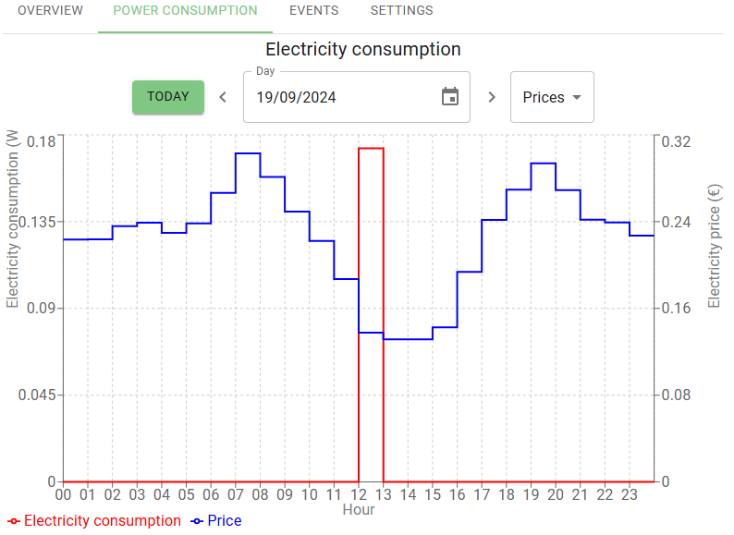
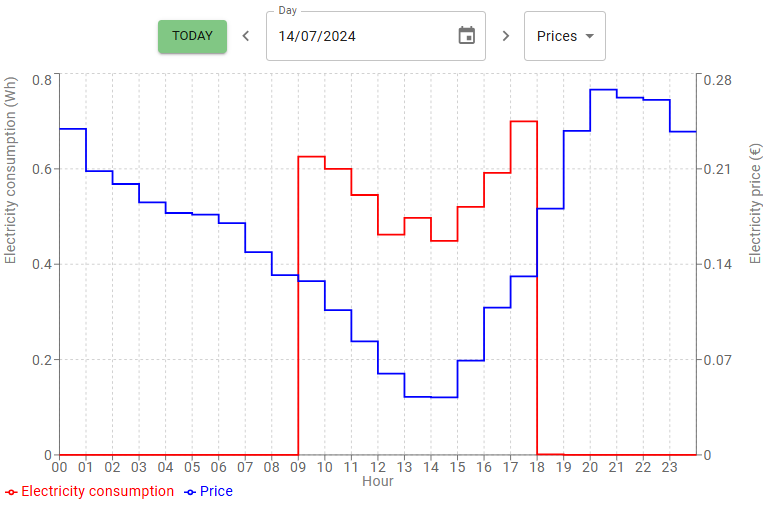
Graph 1 – Power Consumption – One day
The first graph shows the power consumption in Watts (red line) by the device and the energy prices (blue line).
From the dropdown menu, choose Costs (in stead of Prices) to see the costs per hour.
Right below is the link “Total Electricity consumption this day”. Click on this link to view how much electricity has been used by this EcoSwitch on the selected date and what the costs where. It also shows the average costs (you would have paid when having consumed power at random hours) and the amount you have saved by switching smart using the EcoSwitch.
In this example, the EcoSwitch only consumed power (red line) during the nine hours when electricity prices (blue line) were lowest. See the graph below.
Graph 2 – Power – One day
The second graph shows the measured electric power in Watts (red) and the electricity prices (blue).
From the dropdown menu, choose State (instead of Power) to see the state the device was in: on, off, low, normal, boost, max.
Graph 3 – Power Consumption – one week or month
The third is a bar graph showing electricity consumption (red) and costs (blue). On default is one week. Change this to one month in the dropdown menu above the graph. You can select another week or month as well.
Third TAB – EcoSwitch Events
This tab shows actions that have been performed on the device, and the source of the actions.
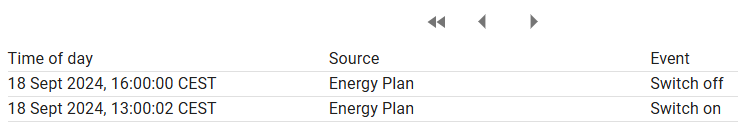
Events are for example:
- Switch on, Switch off
Sources are among others:
- User (cloud): via Ecosoft server
- User (web): via web interface of the Ecosoft device
- Energy Plan
- Restart
These events are the same as found in the web interface of the EcoSwitch itself, at System > Events.
Fourth TAB – EcoSwitch Settings
In the tab “Settings” you can adjust settings, which are adjustable in the web interface of the Ecosoft device as well. See chapter “Using the EcoSwitch Energy Planner” for an explanation.
Which settings are available depends on the type of device. For the EcoSwitch Plus for example: Country, Type of planning, Time-block settings, “Do not switch off when the device is in use”, Maximum price, etc.
Device Management Page for SGC
Click on Dashboard, find the SGC and click on it. You will reach the Device Management page of the SGC where you can adjust more settings and view details. This device page has a number tabs:
- Overview
- Power Consumption
- Events
- Settings
First TAB – SGC Overview
The “Overview” tab shows information on the SGC
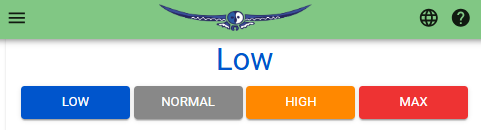
- SG State of connected heat pump: Low, Normal, Boost or Max
- Buttons for remote switching of the heat pump

- State of the relays configured as switches.
- Buttons for remote switching of relays configured as switches.
- Current Schedule: Overview of performed and planned automated switch events.
- Settings: You can change the device name here. This name will be shown in the Dashboard and Devices List.
- Service: Shows the number of days of service with the current license. License extensions are available on the website.
- Last synchronization: Timestamp of time and date of the most recent moment the device sent data to the server. The device only sends something when there is actually new data to send. Therefore this moment may be behind the current date and time.
- State: Low, Normal, Boost, or Max.
- Time of day: Timestamp of the measurement. This is not the same as the timestamp of the sending of the data.
- Delete Device: Button to remove the device from the account completely. All data sent by the device will be deleted from the server. Synchronization will be stopped. When you wish, you can go to the web interface of the device and connect it to the server again, and send the available data from the device to the server again.
Second TAB – SGC Power Consumption
The tab “Power Consumption” shows a number of graphs.
For these graphs, you can check or uncheck the boxes “VAT” and “other taxes”. The “Today” button sends you to today’s graph. You can choose another date as well.
Graph 1 – Power Consumption – One day
The first graph shows the power consumption in Watts (red line) by the device and the energy prices (blue line).
From the dropdown menu, choose Costs (in stead of Prices) to see the costs per hour.
Right below is the link “Total Electricity consumption this day”. Click on this link to view how much electricity has been used by this SGC 2 on the selected date and what the costs where. It also shows the average costs (you would have paid when having consumed power at random hours) and the amount you have saved by switching smart using the SGC 2.
The example below shows a graph for the SGC. The switch was in the normal state (red line) for about 3 hours when electricity prices (blue line) were lowest. See the graph below.
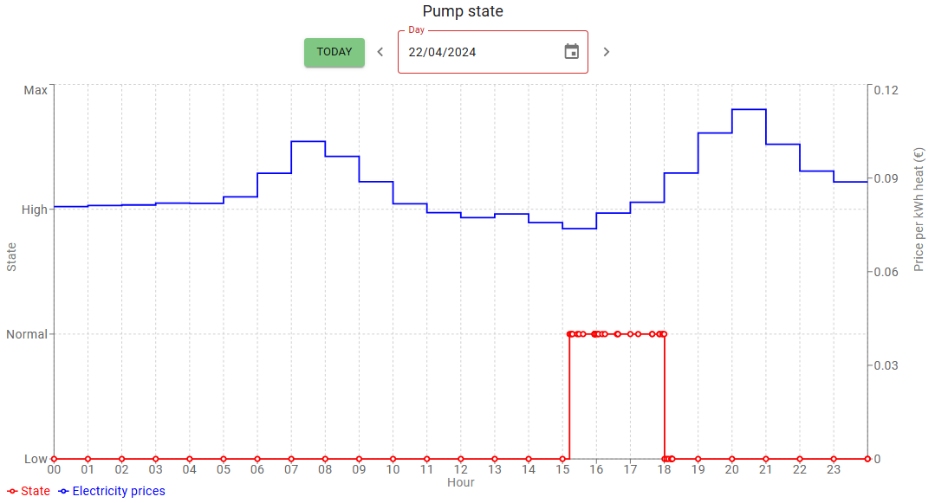
Graph 2 – Power – One day
The second graph shows the measured electric power in Watts (red) and the electricity prices (blue).
From the dropdown menu, choose State (instead of Power) to see the state the device was in: on, off, low, normal, boost, max.
Graph 3 – Power Consumption – one week or month
The third is a bar graph showing electricity consumption (red) and costs (blue). On default is one week. Change this to one month in the dropdown menu above the graph. You can select another week or month as well.
Third TAB – SGC Events
This tab shows actions that have been performed on the device, and the source of the actions.
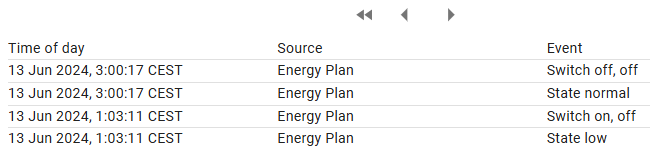
Events are for example:
- “Switch off, off” (two relays assigned to SG-ready were switched off), State low, State normal, State boost, State max
Sources are among others:
- User (cloud): via Ecosoft server
- User (web): via web interface of the Ecosoft device
- Energy Plan
- Restart
These events are the same as found in the web interface of the SGC 2 itself, at System > Events.
Fourth TAB – SGC Settings
In the tab “Settings” you can adjust settings. They are adjustable in the web interface of the Ecosoft device as well. See chapter “Using the SGC Energy Planner” from the SGC manual for an explanation of these settings.
Which settings are available depends on the type of device. For the SGC 2 for example:
Energy Planner
Country, City (weather), Heating type, Heat pump efficiency (COP at certain temperatures), Heat pump control (switcher to enable or disable), Settings for the costs saving energy plan
Connections
Settings for connections to devices and sensors. P1 meter, Shelly EM, Solar inverter, Use excess power.
Control rules
Configurable conditions under which the SGC performs certain actions, based on received data like temperature sensor read-outs.
Relay functions
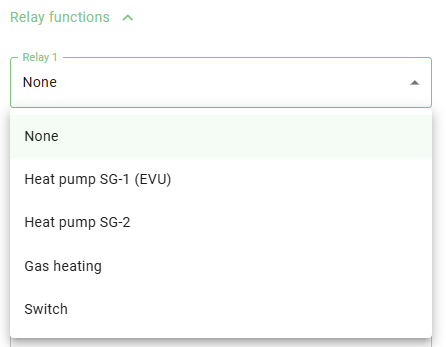
Configuration of relay functions: None, Heat pump SG-1 (for SG-ready and EVU), Heat pump SG-2 (for SG-ready only), Gas heating, Switch (let the relay act like a switch).
Note: These settings are available in the web interface of the SGC 2 as well.
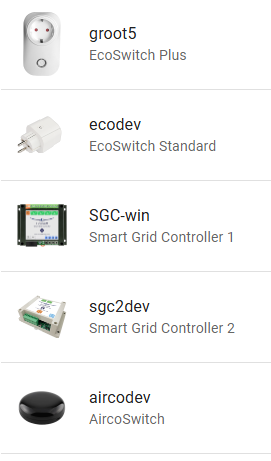
Ecosoft Server Devices
 Click on Devices in the left menu. This page shows a list of connected Ecosoft devices. Click on a device to go to the page of the device, where detailed information and adjustable settings are available.
Ecosoft Server Profile
 Click on Profile in the left menu to set personal data, including First name, Last name, Email address, and Password.
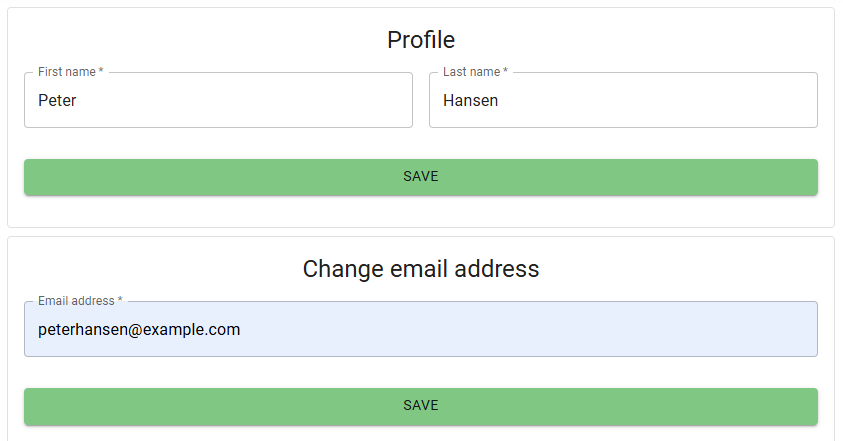
It is possible to delete the account with the button below.

Ecosoft Shop
 Menu item Shop in the left menu is a link to the Ecosoft Energy Shop. You can purchase Ecosoft devices and licenses there.
Ecosoft Server Sign Out

Click on Sign Out in the left menu to sign out.
English Ecosoft Cloud manual version 3.5